
Observability
aiod writes JSON logs to stdout, serves Prometheus metrics on GET /metrics, and exports OpenTelemetry traces when an endpoint is configured. Nothing is pushed by default.
Logs
One JSON line per request on stdout, tagged HTTP_REQUEST and carried on the app.request target. The payload:
Credentials are redacted before the line is written. A query parameter or body field whose name contains a known marker — api_key, authorization, token, password, secret, cookie, ticket, and the rest of that family — is replaced by its length and a short SHA-256, enough to tell two values apart without carrying either:
Only a bounded JSON body is summarized like that: application/json, an explicit Content-Length, and at most 8 KiB. An upload, a stream, a WebSocket handshake, and anything larger pass through untouched, and the entry says so with captured: false and a reason. The body still reaches the handler byte for byte.
aiod takes the request id from x-tt-logid, x-logid, x-log-id, or x-request-id, and generates one when the request carries none. It answers with the id in x-tt-logid and forwards it to computer-use, so one id spans both processes:
Metrics
Prometheus text format, rendered on request. /metrics requires the API key when one is set. Four series:
Both histograms share the same buckets, 1 ms to 30 s. A request that matched no route folds into a single <unmatched> label, so scanning for endpoints cannot blow up the series count.
OpenTelemetry traces
Off by default. Enable with one variable:
The signal-specific _TRACES_ spelling of a variable wins over the generic one. Under http/protobuf the generic endpoint is a base URL that gets /v1/traces appended, while OTEL_EXPORTER_OTLP_TRACES_ENDPOINT is used as it stands.
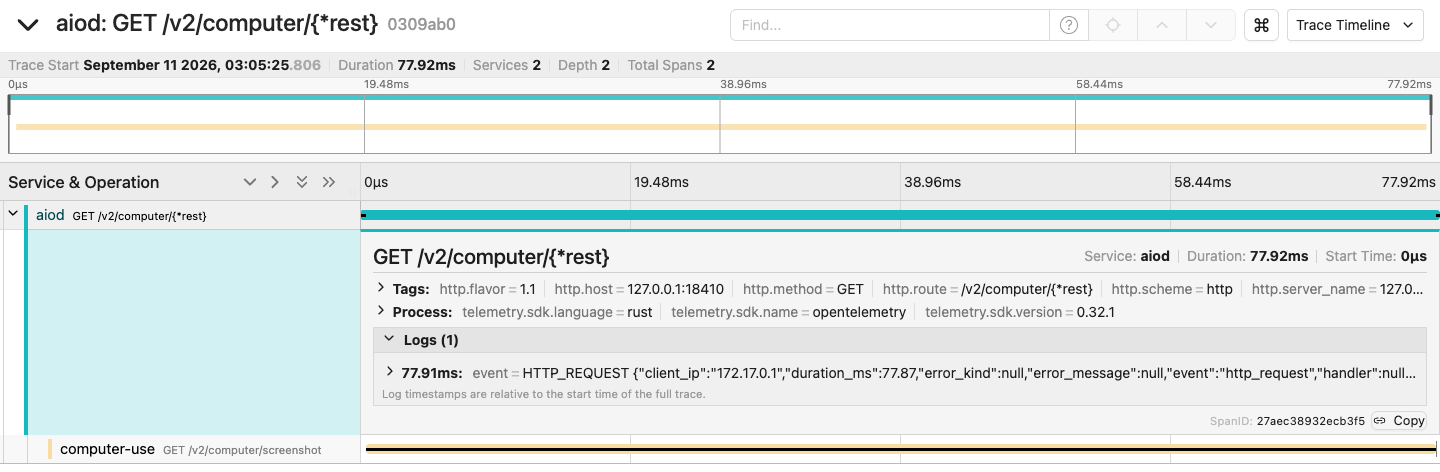
One span per request (otel.kind server, with http.method and http.route). Trace context propagates: a caller's trace continues through the daemon into computer-use.
Only plaintext http:// collectors are supported: no TLS backend is compiled in.
Related
- Authentication — the key
/metricsasks for - Error Handling — the statuses
error_kindreports